
PMI - Data visualization and acquisition software
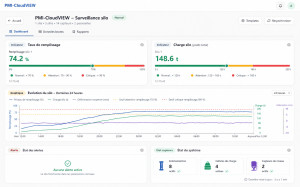
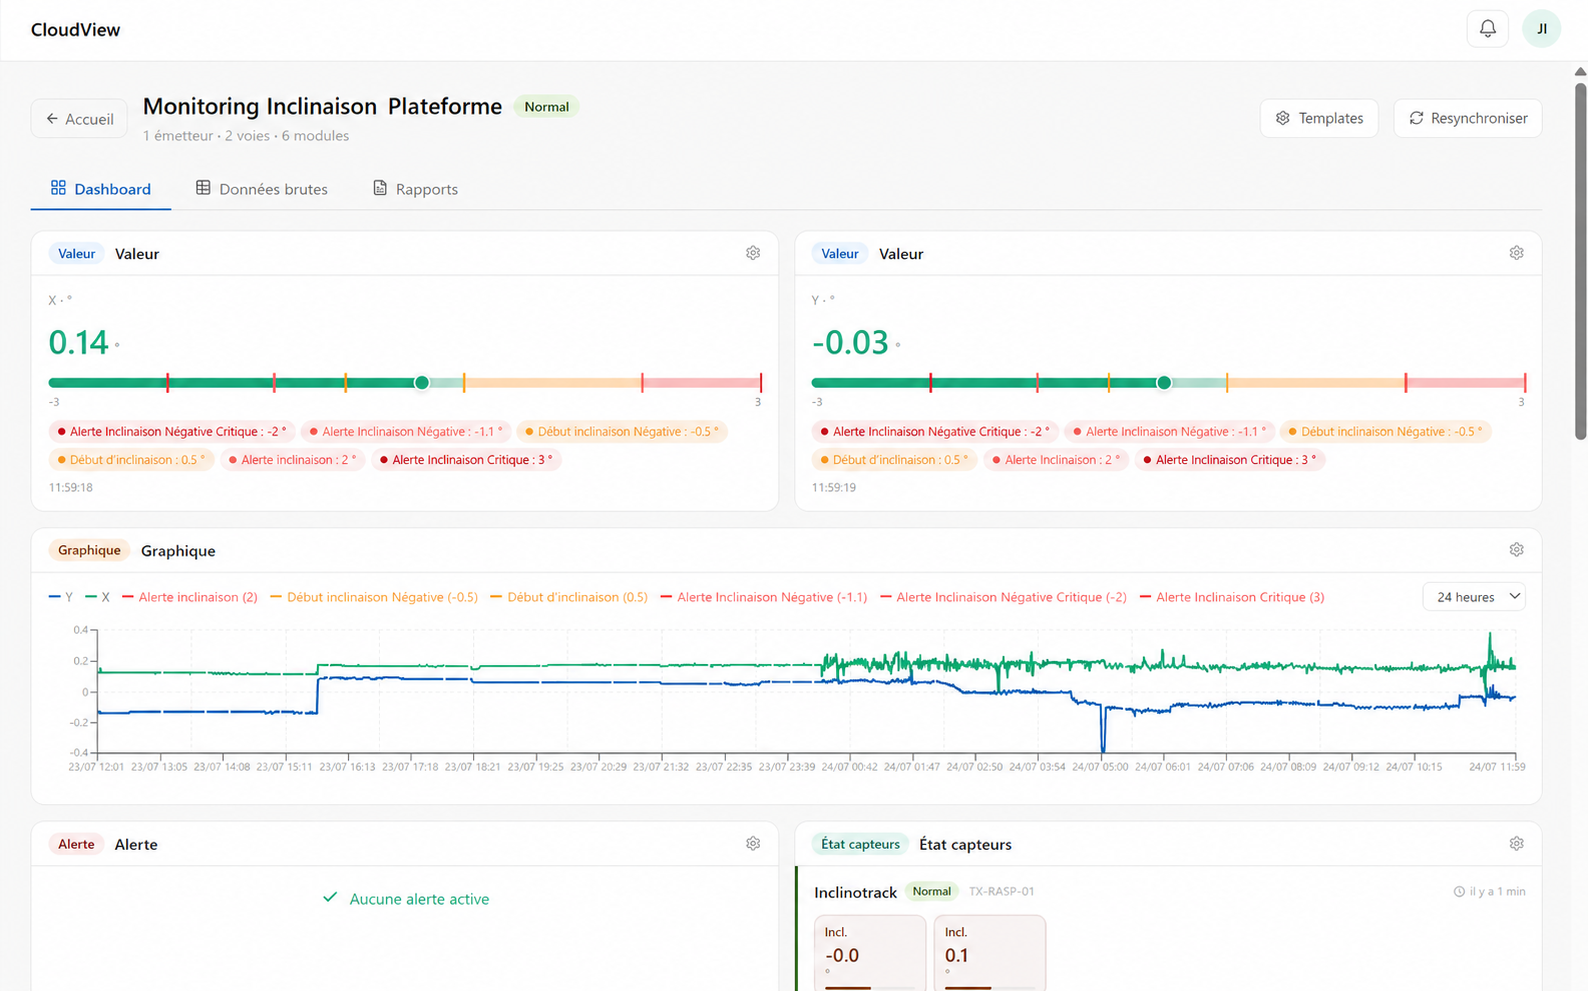
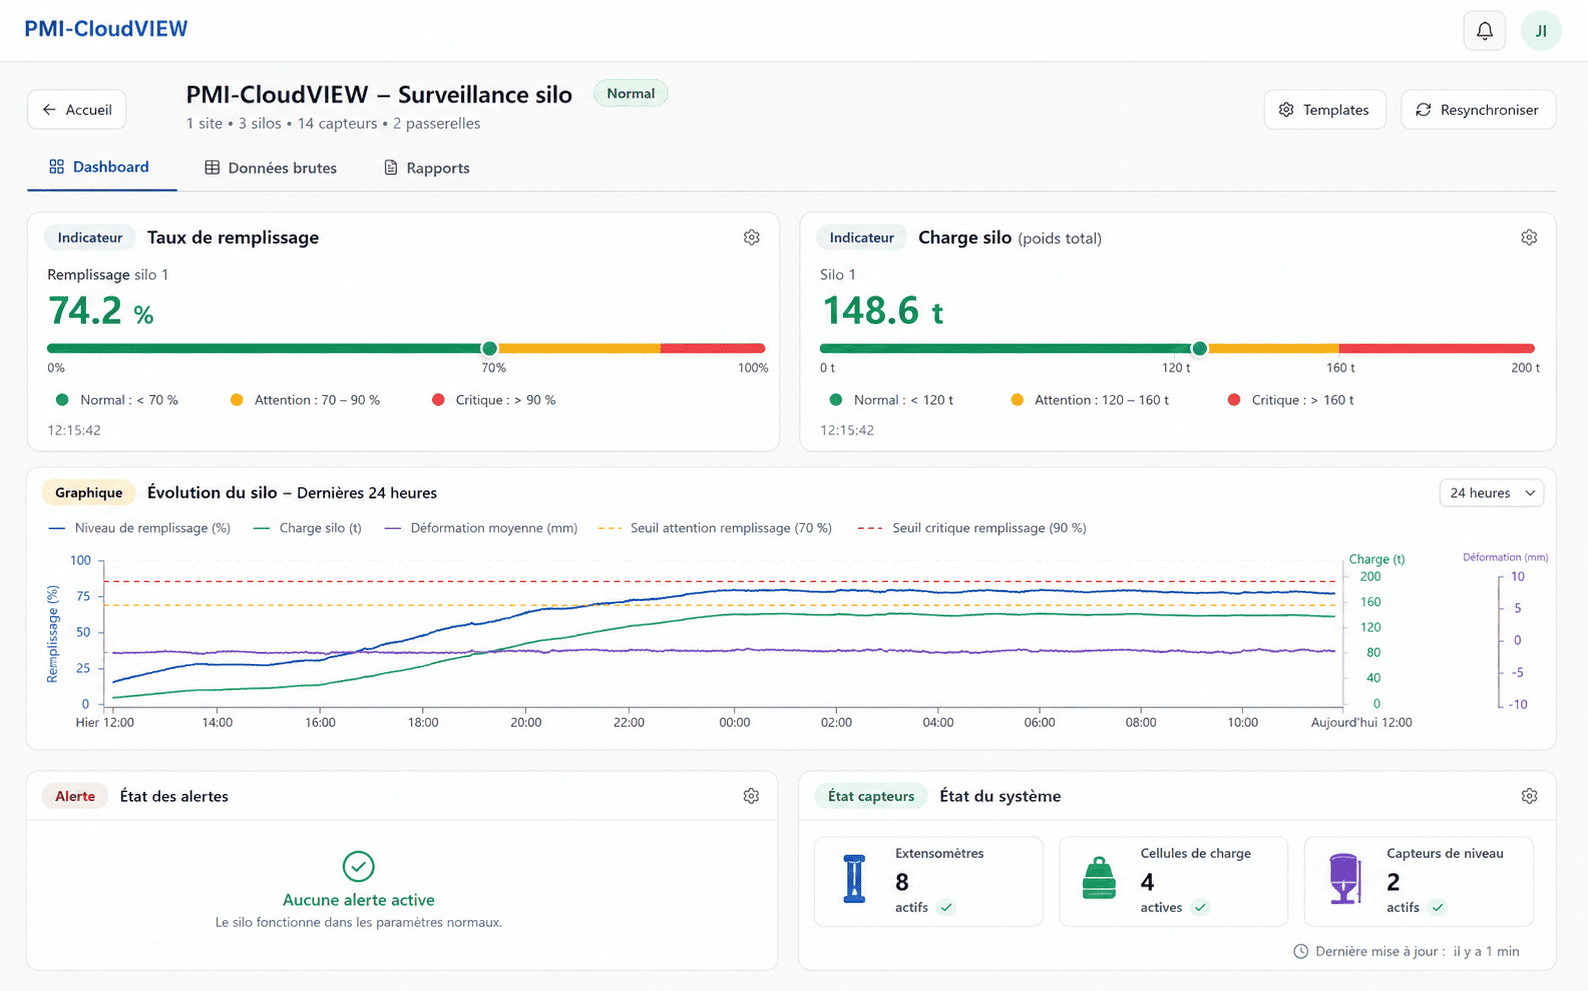

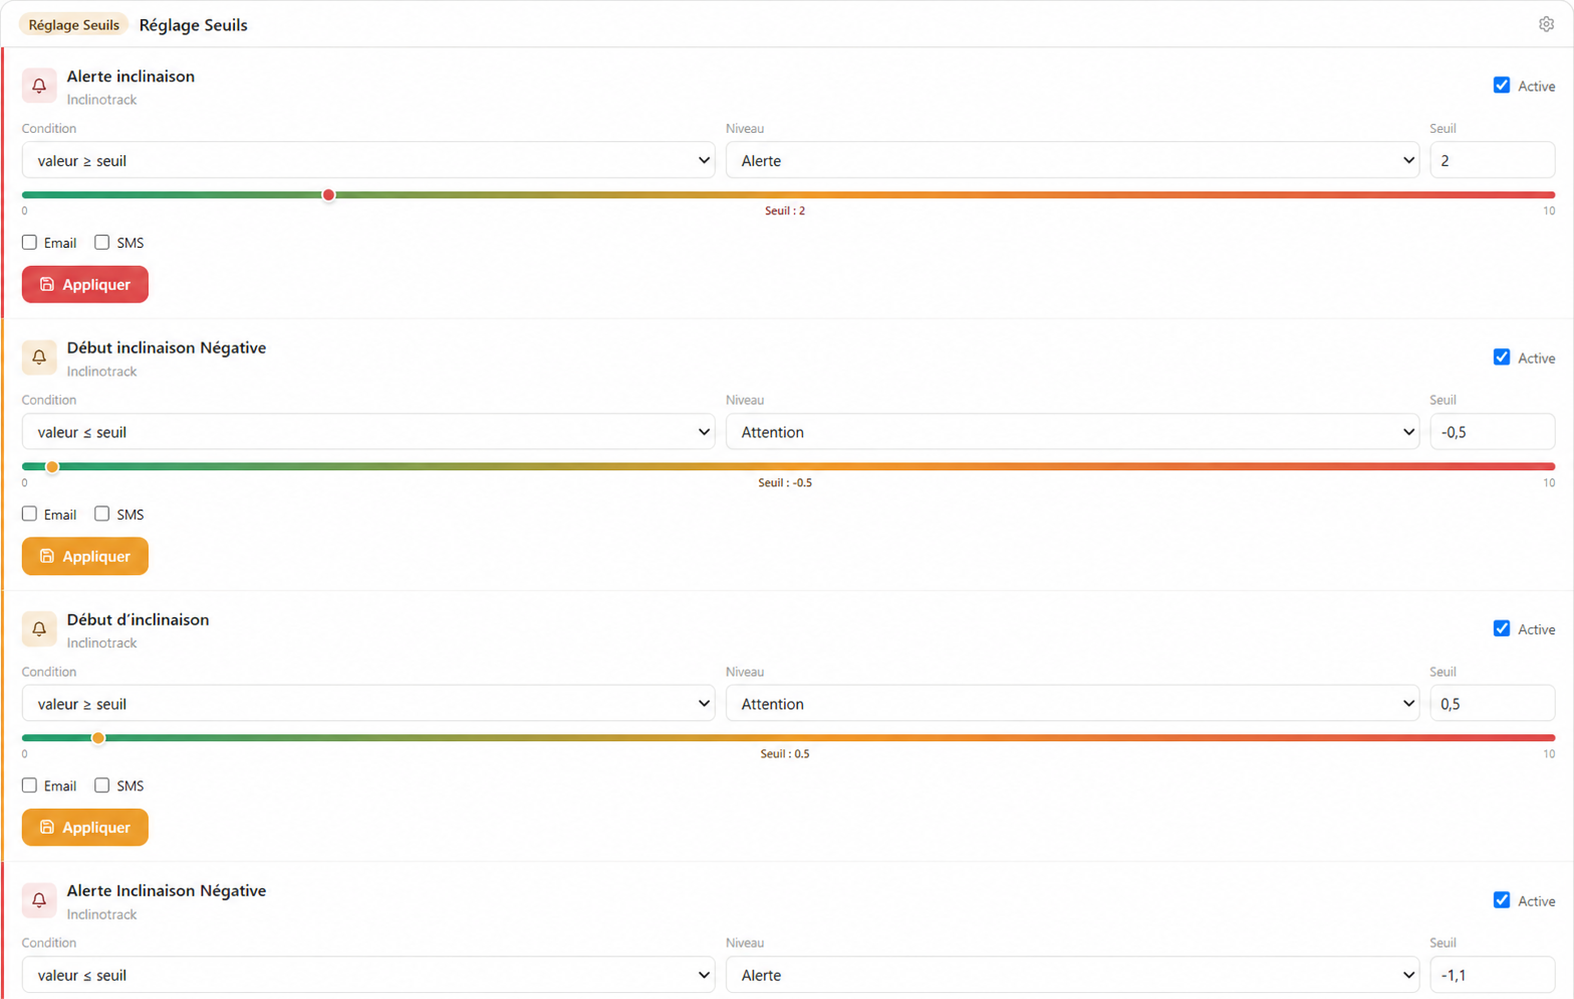
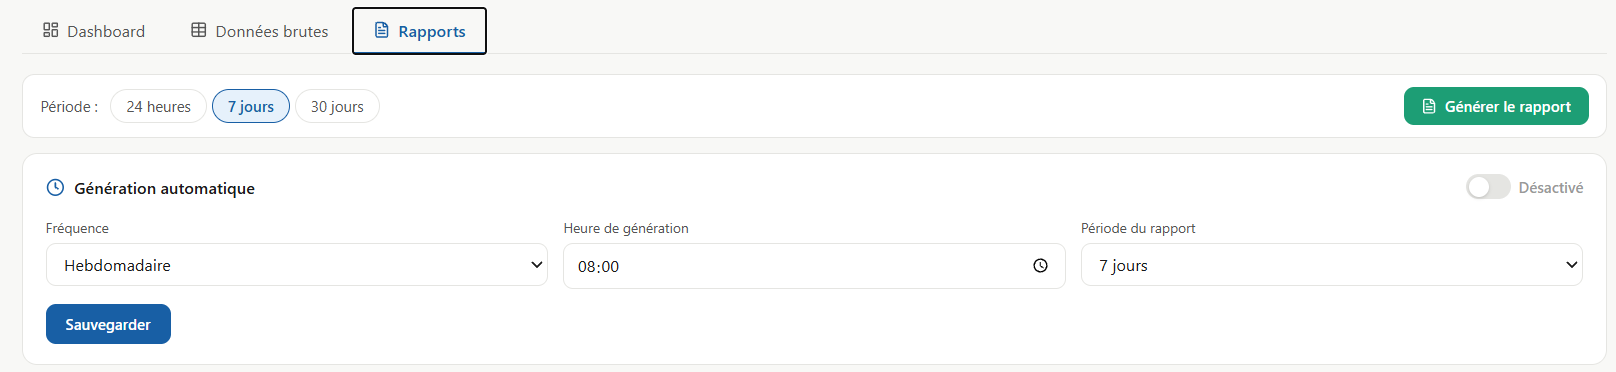
- Web-based supervision platform for PM Instrumentation monitoring systems
- Real-time visualization and historical measurement review
- Customizable dashboards by site, structure and sensor type
- Threshold, alarm and notification management via e-mail or SMS depending on configuration
- Comparison and correlation of data from multiple sensors
- Data export and integration into customer systems via API
- Hosted on a PMI server or on the customer's infrastructure
- Secure access from a web browser, with no software installation required
Overview
PMI-CloudView is a web-based supervision platform designed for the visualization, operation and remote monitoring of data from monitoring systems deployed by PM Instrumentation.
It centralizes measurements from sensors and data loggers installed on infrastructures, civil engineering structures, industrial equipment or geotechnical sites. Users therefore have a single interface to check the status of their installations, analyze the evolution of measured parameters and manage the associated alarms.
The platform can be used with the PMI-LOGGER-BF, PMI-LOGGER-HF, PMIOT-STAND data loggers, the PMI-IoT connected sensors, as well as with third-party systems integrated into a specific monitoring architecture.
Architecture and data upload
Data measured in the field is collected by the sensors and acquisition systems, then automatically transmitted to PMI-CloudView via the connection available on site.
Depending on the chosen architecture, transmission can be carried out over a wired network, an Ethernet connection or cellular communication. The data upload frequency is configurable according to the application, the desired autonomy and the dynamics of the monitored phenomena.
The platform makes it possible to centralize information from multiple sites, structures or equipment within a single supervision environment.
This architecture enables:
- automatic collection of measurements
- centralization of data from multiple sensors
- remote monitoring of installations
- retention of a measurement history
- access to data from a web interface
- integration of data into the customer's tools via API
PMI-CloudView functions
Real-time visualization
PMI-CloudView can display the latest measurements transmitted by the acquisition systems in various forms:
- instant numerical values
- time curves
- trend indicators
- gauges and status indicators
- measurement tables
- location maps
- photographs and descriptive site information
The presentation is adapted to the type of project and the monitored parameters: inclination, displacement, deformation, vibration, pressure, temperature, water level or any other quantity measured by the instrumentation.
Historical data review
Users can review the evolution of the data over a selected period in order to identify trends, drifts or specific events.
The navigation tools allow, among other things:
- selecting an analysis period
- zooming in on an event
- comparing several measurement channels
- displaying several sensors simultaneously
- reviewing the values associated with each timestamp
- analyzing the evolution of a parameter before, during and after an event
The data retention period depends on the hosting architecture and the requirements defined for the project.
Custom dashboards
Each dashboard can be configured according to the application, the number of sensors and the information expected by the customer.
The platform can bring together on a single page:
- the description of the structure or equipment
- the main site information
- the geographical location
- the measured values
- the evolution curves
- the status of sensors and data loggers
- the battery level of autonomous systems
- the transmission frequency
- active alarms and the event history
This customization ensures that only the information useful for operating the system is displayed.
Measurement comparison and correlation
Data from multiple sensors can be displayed and compared over the same period.
This function allows, among other things:
- comparing several zones of a structure
- identifying differential displacement
- correlating a measurement with temperature
- comparing the behavior of several axes
- analyzing variations before and after works
- highlighting a common or localized evolution
Depending on the needs of the project, calculated indicators can be integrated to facilitate data interpretation and the detection of abnormal behavior.
Alarm management
Monitoring thresholds can be defined for each sensor or measured parameter.
When a value reaches or exceeds a configured threshold, PMI-CloudView generates an event visible in the interface. Depending on the chosen configuration, a notification can also be sent to designated persons.
Alarm management can include:
- multiple threshold levels
- distinct thresholds for each sensor or measurement axis
- timestamping of threshold exceedances
- identification of the sensor concerned
- alarm history
- acknowledgment and resetting of events
- sending notifications by e-mail
- sending notifications by SMS depending on configuration
This functionality enables operators to be quickly informed when unusual behavior is detected.
Data export and use
The recorded data can be exported to perform additional analyses, produce reports or be integrated into the customer's business tools.
Depending on the project configuration, the data can be retrieved via:
- CSV file export
- download from the web interface
- automatic transfer to a remote server
- availability via API
- connection to a database or third-party platform
The raw data thus remains available for advanced processing carried out by the customer, an engineering firm or a monitoring specialist.
Site and user management
PMI-CloudView makes it possible to supervise multiple installations from a single interface.
Projects can be organized by:
- customer
- site
- structure
- instrumented zone
- type of application
- sensor family
Distinct access accounts can be created for users according to their duties and authorization level. This organization facilitates the sharing of information between operators, engineering firms, site managers and infrastructure managers.
Data hosting
The hosting architecture is defined according to the requirements of the project.
Several configurations can be offered:
- hosting on infrastructure managed by PM Instrumentation
- hosting on a server dedicated to the project
- installation on the customer's IT infrastructure
- data transfer to a third-party platform
- data availability via API
This flexibility allows the solution to be adapted to IT constraints, internal policies and the data control requirements of each customer.
Compatible systems
PMI-CloudView can be integrated with various acquisition systems and monitoring solutions:
- PMI-LOGGER-BF for monitoring slow phenomena
- PMI-LOGGER-HF for dynamic signal acquisition
- PMI-IoT connected sensors
- autonomous geotechnical data loggers
- analog sensors connected to an acquisition unit
- digital sensors using industrial protocols
- third-party systems with a compatible communication interface
The platform configuration is adapted to the sensors, the measurement frequencies and the requirements of each application.
Applications
- monitoring of buildings and structures
- monitoring of bridges and footbridges
- monitoring of tunnels and underground structures
- monitoring of slopes and landslides
- groundwater and pore pressure monitoring
- monitoring of railway lines
- monitoring of dikes and dams
- monitoring of silos and tanks
- monitoring of offshore platforms
- vibration monitoring of structures
- condition-based maintenance of industrial machinery
- monitoring of construction sites and sensitive infrastructures
Benefits
- centralized access to all monitoring data
- remote access from a web browser
- clear visualization of measurements and their evolution
- dashboards tailored to each project
- rapid detection of threshold exceedances
- complete history of measurements and alarms
- reduction of site visits required
- possible integration into the customer's IT tools
- scalable architecture allowing the addition of new sensors
- support from PM Instrumentation for configuration and deployment
Access and commissioning
The platform is accessible from a web browser and does not require the installation of any specific software on the user's workstation.
Commissioning includes, depending on the project scope:
- creation of the site and its users
- integration of sensors and measurement channels
- creation of dashboards
- configuration of units and scales
- definition of alarm thresholds
- configuration of notifications
- setting up exports or the API
- validation of data upload
PM Instrumentation supports the customer during the configuration, acceptance testing and onboarding phases of the platform.
Key features
- Type: web-based supervision and monitoring platform
- Access: web browser
- Display: numerical values, curves, tables, maps and indicators
- Management: multi-site, multi-sensor and multi-user
- Data: real-time and historical
- Alarms: configurable thresholds and event history
- Notifications: e-mail and SMS depending on configuration
- Export: CSV and data transfer depending on configuration
- Integration: API available
- Hosting: PMI server, dedicated server or customer infrastructure
- Compatibility: PMI data loggers, PMI-IoT sensors and third-party systems
- Configuration: tailored to the needs of each project
- Application
- DAQ universel
- PMIOT-STAND
- PMI-LOGGER-BF
- PMI-LOGGER-HF
Related products
Inclinotrack
PMIOT-STAN
GEO-LOGGER-M
 +33 1 46 91 93 32
 Contact form
 Subscribe to the newsletter